About This Website

In the year 1835 the advent of modern weather forcasting began. With the invention of the eletric telegraph, weather reports were now a commodity that could be recived nearly instantenously. From this innovation, through to the modern day, immense progress continues to be made to improve the ability to track, record, predict, and forecast the weather. One such feat of this progress is the ability to access weather data from tens of thousands of weather recording stations/instruments at a moments notice. All by the simplicity of a URL.
Thanks to the OpenWeather Current Weather Data API the ability to access global weather data is open source data. With that kind of access, one can easily explore locale dependant weather related questions. What is the temperature in a given city? Is it windy in that city? And the humidity? Well, of course this is all simply accessed with a quick Google search. Now, what if you wanted to know the answer to these quesitons for hundreds of cities, at once?
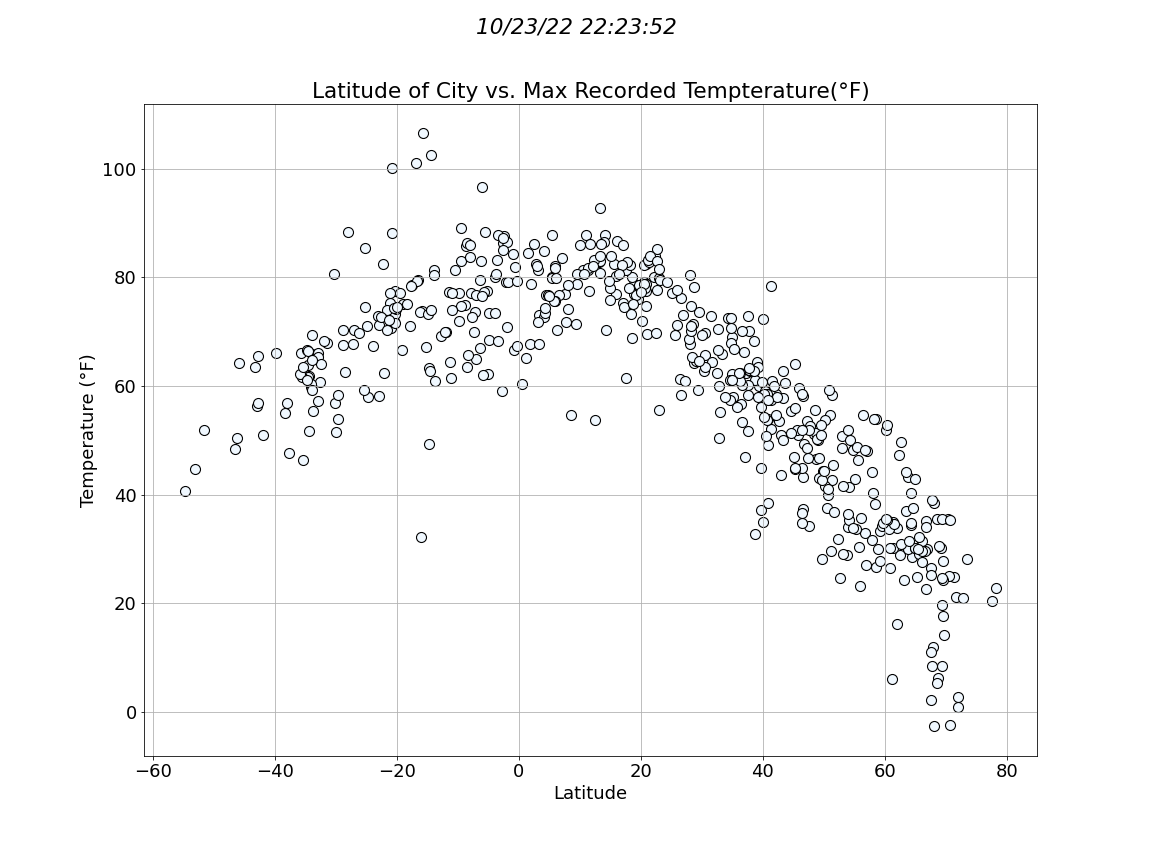
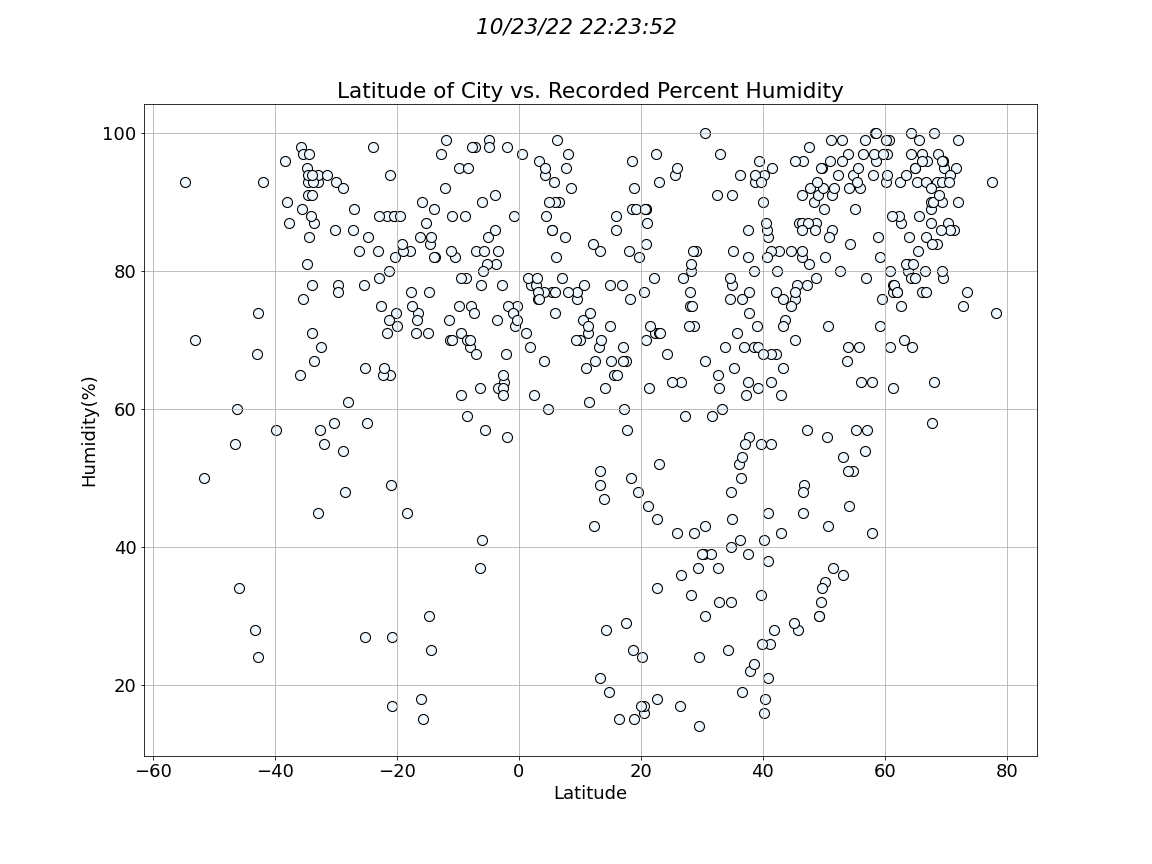
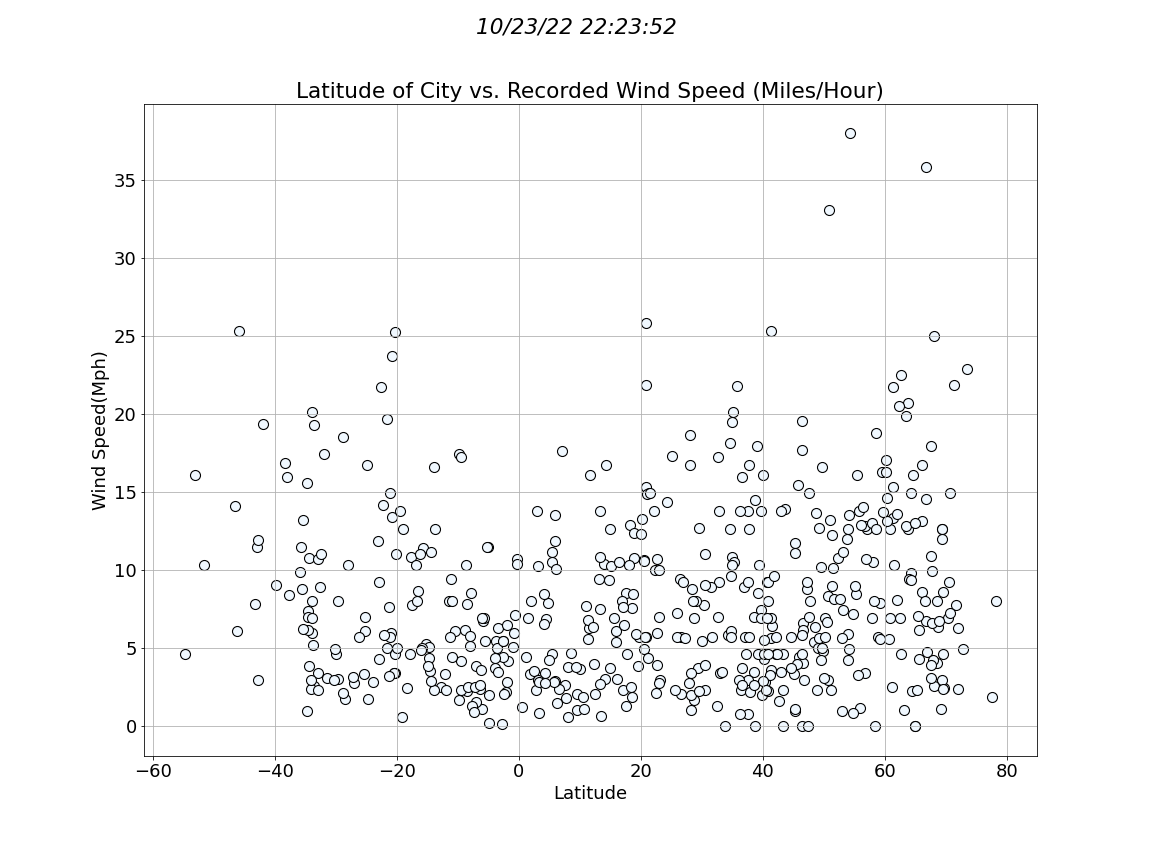
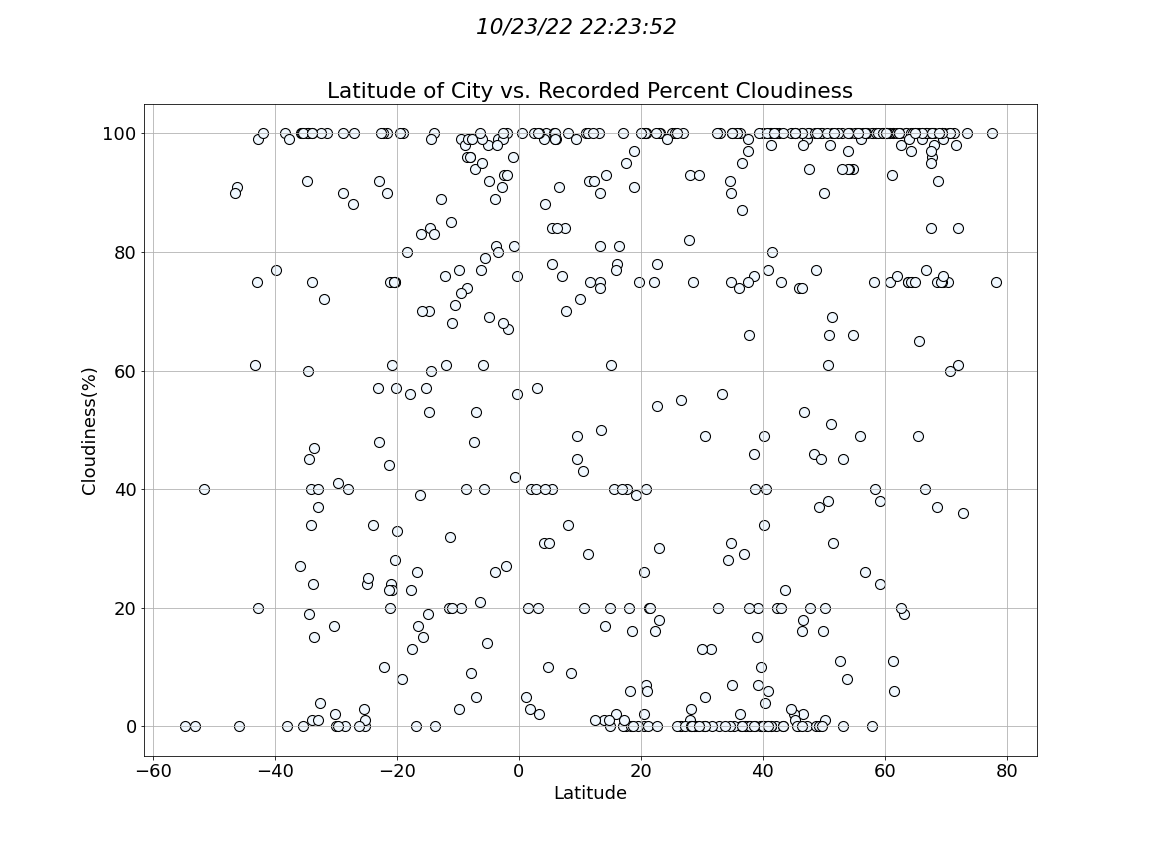
The data visualized in this website was gathered on that very premise. IS there an observable difference in the weather the closer one gets to the equator? Surely, it must be. So, utilizing Python to make API calls to Open Weathers free service, 555 cities were queried for their weather data. The data recieved was transformed into plots found on this website by using Matplotlib. These plots visualize the latitude of the cities in the datset plotted against different weather elements.


